


The Psychrometric Chart: Fundamentals, Advantages, Disadvantages & Applications
This work is licensed under CC BY-SA 4.0 - Creative Commons Attribution-ShareAlike 4.0 International.

Fundamentals:
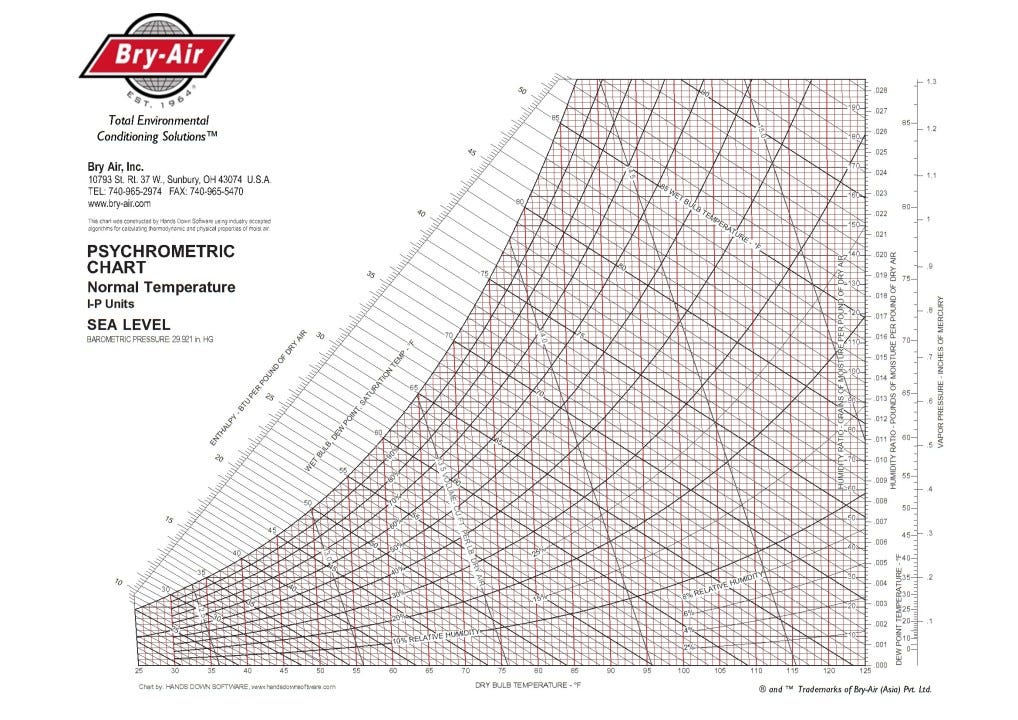
A psychrometric chart consists of the following seven parameters [I have used imperial, (I-P) units for this article]:
Dry bulb temperature, DB (°F): When air is passed over the dry bulb of a thermometer, the temperature recorded by the instrument is called DB. This parameter is represented by straight lines, not precisely parallel to each other & inclined slightly from the vertical position.
Wet bulb temperature, WB (°F): When a wet wick is covered over the bulb of the thermometer and air is passed over it, the temperature recorded by the instrument is called WB. It is represented by diagonal lines sloping downwards towards the right. These lines are straight but aren’t precisely parallel to each other.
Dew point temperature, DP (°F): When air is being cooled slowly but steadily for measurement, the point at which moisture starts condensing is called dew point temperature. This parameter is represented by horizontal lines.
Relative humidity, ɸ (%): It is the ratio of the partial pressure of water vapour in the air to the saturation vapour pressure of water at the same temperature. It can also be defined as the ratio of the amount of water vapour in a unit volume of air at a certain temperature to the amount of water vapour contained by the same sample of air when the air is saturated at the same temperature. It is represented by curved lines.
Enthalpy, h (BTU/lb.): Enthalpy of moist air is the sum of the sensible & latent heat per unit mass of dry air. ‘h’ lines are represented by diagonal lines sloping downwards towards the right. In some charts, these lines have the same slope as that of WBT lines. Enthalpy lines are precisely parallel to each other.
Humidity ratio, w (gr./lb.): It is the mass of water vapour contained in a unit mass of dry air. These lines are represented by horizontal lines.
Specific volume, ν (ft3/lb.): It is the volume per unit mass of dry air. ‘ν’ lines are diagonal lines sloping downwards towards the right. These lines are much steeper than the ‘h’ lines & the WBT lines. Specific volume lines are straight but not precisely parallel to each other.
Psychrometric charts in which the slope of the 'h' lines & WBT lines are the same, enthalpy deviation lines are provided for correction of enthalpy. However, if the slope of the 'h' lines & WBT lines are slightly different, enthalpy deviation lines are not needed.
Since the properties of air change with change in altitude, psychrometric charts are generally available for mean sea level (0 ft.), 2500, 5000, 7500 & 10000 ft. These charts are also available for different ranges of temperature.
Types:
There are 2 types of psychrometric charts, paper-based or non-virtual charts & interactive or virtual charts.
Paper-based or non-virtual psychrometric charts
Advantages:
The advantages of paper-based psychrometric charts over psychrometric formulae, thermodynamic tables, & psychrometric calculators:
Psychrometric charts are useful to understand the psychrometric processes occurring in various situations, whether there is only sensible heating/cooling, or humidification/dehumidification without any change in temperature or a combination of both.
Since it is tedious & time-consuming to do psychrometric calculations using tables or formulae, it is sometimes more convenient to use these charts to do the calculations.
All charts consist of 7 parameters, namely dry bulb temperature (DBT), wet bulb temperature (WBT), dew point temperature (DPT), humidity ratio (w), enthalpy (h), specific volume (ν) & relative humidity (ɸ). If any 2 out of the 7 parameters of a particular condition of air, also called a state point are given, the rest of the 5 parameters can be found out. This is an advantage over some calculators in which the DBT must be one of the 2 input parameters.
Some charts have the sensible heat factor (SHF) scale included along with 7 parameters such that the line joining the alignment circle, which is a state point usually in the comfort condition of human beings; & the value 1 on the SHF scale is parallel to the abscissa (X-axis) of the chart. This scale helps find the SHF of a psychrometric process occurring between the alignment circle & another state point.
Charts are useful to find the properties of dry air, i.e., at 0% ɸ, which is an advantage over some calculators in which ɸ must be above zero %.
Disadvantages:
However, paper-based psychrometric charts are not without any drawbacks, which are as follows:
Charts are more time-consuming & less accurate than calculators.
Properties of air other than the 7 parameters cannot be directly found in the charts.
Charts are not always available for all kinds of altitudes & temperature ranges.
Interactive or virtual psychrometric charts
Interactive psychrometric charts have several advantages over paper-based psychrometric charts:
These charts are easier to use because they allow you to input data directly and get immediate results. You don’t need to manually plot points or draw lines as you would with a paper chart.
Virtual charts can provide more accurate results because they use precise calculations based on the input data. There’s less room for human error compared to manually plotting points on a non-virtual chart.
With a digital chart, you can get results instantly, especially when dealing with complex calculations or large amounts of data.
Applications:
Psychrometric charts are very useful for studying the psychrometric processes of HVAC equipment like air handling units (AHUs), cooling towers, evaporative coolers, rotary energy wheels, heat pipes, economizers, etc.
They are also useful for designing HVAC systems for natatoriums, cleanrooms, etc.
References:
“Fundamentals of Psychrometrics – Second Edition” by Don Brandt, published by ASHRAE Learning Institute.
ASHRAE Handbook – Fundamentals (2021).
“Psychrometrics – Level 1: Introduction” (Technical Development Program), published by Carrier Corporation
“Psychrometrics Program” by Daikin Europe NV.
My LinkedIn post on the fundamentals of the psychrometric chart: https://www.linkedin.com/posts/rushikeshjog_psychrometric-chart-insight-partners-activity-7180424362628431872-K0wz?utm_source=share&utm_medium=member_desktop
My LinkedIn post on “Advantages, disadvantages, and applications of the psychrometric chart”: https://www.linkedin.com/posts/rushikeshjog_do-you-still-use-psychrometric-charts-i-activity-7179489564078587904-J3Fe?utm_source=share&utm_medium=member_desktop
“Psychrometric Chart” constructed by Hands Down Software and published by Bry-Air.
This article was first published on LinkedIn through my newsletter “The HVAC+ Newsletter”. Here’s the link to the article:
Please subscribe to my newsletter on LinkedIn “The HVAC+ Newsletter”. Here’s the link to my newsletter on LinkedIn:
https://www.linkedin.com/newsletters/the-hvac-newsletter-7152286861527244800/
Please connect with me on LinkedIn. Here’s my profile: https://www.linkedin.com/in/rushikeshjog/
Please follow me on Substack. Also, do subscribe to my newsletter on Substack “The HVAC+ Newsletter”. Here’s the link to my newsletter on Substack:

This work is licensed under CC BY-SA 4.0 - Creative Commons Attribution-ShareAlike 4.0 International.
https://creativecommons.org/licenses/by-sa/4.0/?ref=chooser-v1